In this step we will set up a simple Leaflet webviewer and connect it to our GeoServer. If you haven’t set up a GeoSever yet, please start at step 2: Setting up a Geoserver.
1. First we need a JavaScript and HTML editor for creating our webviewer. You can use any editor you like for this tutorial. If you don’t have one installed yet, I like Atom: https://atom.io/
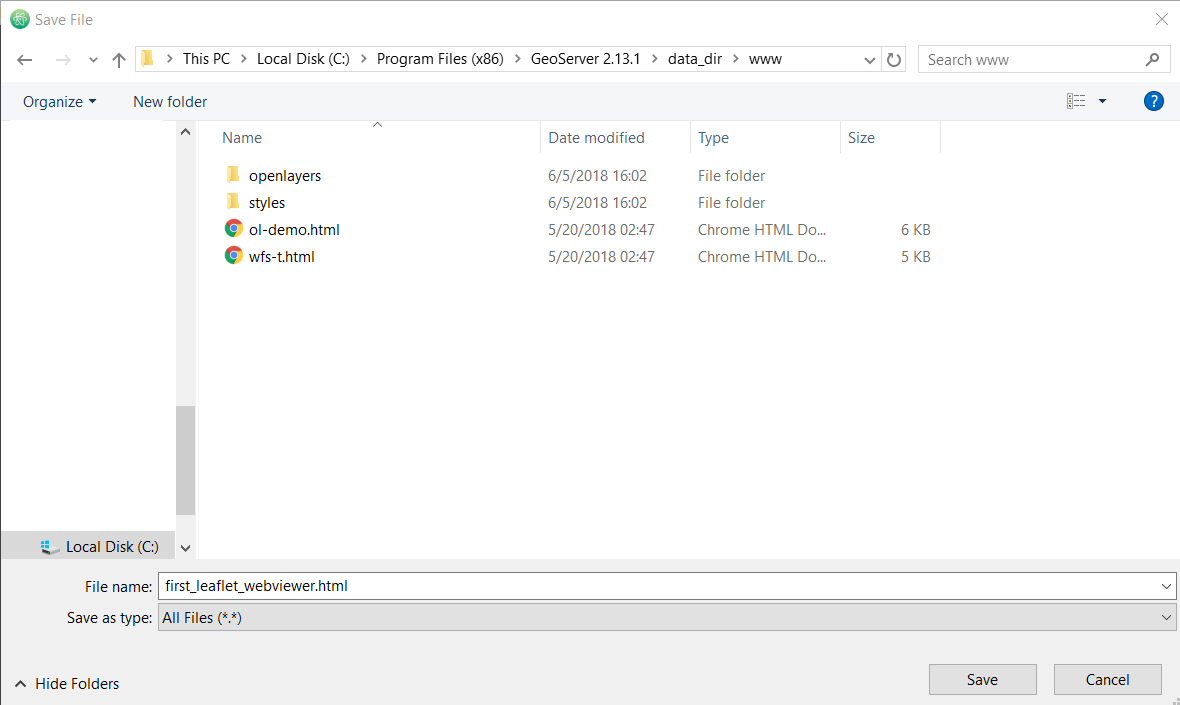
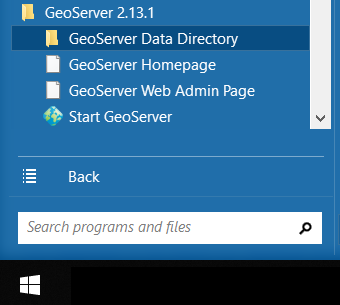
2. GeoServer had a dedicated folder for serving html/JavaScript webpages. Go to GeoServer Data Directory (Start => All Programs => GeoServer … => GeoServer Data Directory) and open the folder ‘www’.
3. Open your editor (for example ‘Atom’) and create a html file and save it in the ‘www’ folder you just opened. Let’s call it ‘first_leaflet_webviewer.html’.

4. Now we will write our basis for the webviewer. The only thing this webviewer will do is show a Open Street Map of the world. Just copy and past the following code:
Now we would like to add our own data. Since we would like to use our data as vector (so including all the feature information) we would like to use a WFS connection but without downloading all the vector data as once. This is an ideal user-case for vector tiles. Unfortunately neither GeoServer nor Leaflet supports vector tiles out-of-the-box. So we will need to install some extensions.
4. Download the vector tile extension of geoserver. Go to http://geoserver.org/release/stable/ scroll down to ‘Extentions’ and click on ‘extension’. Now download the vectortiles-plugin.zip.

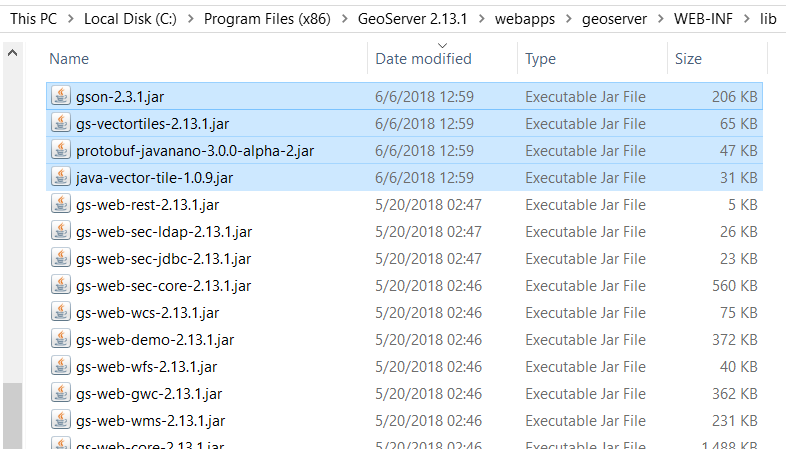
5. Unpack the zip-file and move all the contents to the ‘lib’ folder in the ‘WEB-INF’ folder of GeoServer.
6. Now stop and restart the geoserver.

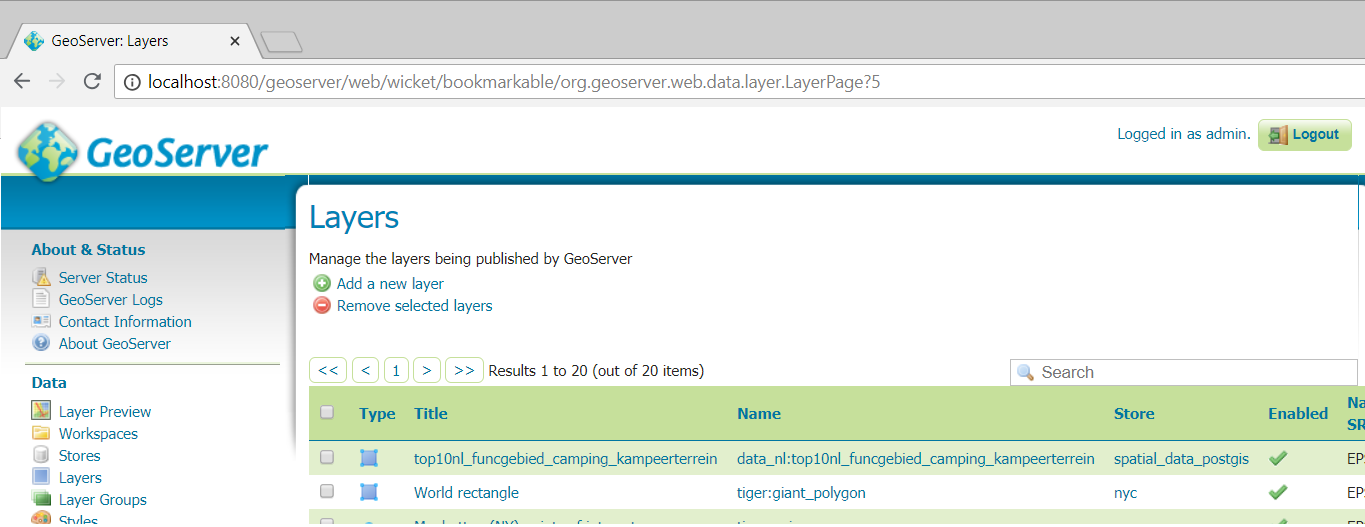
7. Login on your GeoServer and go to ‘Layers’.
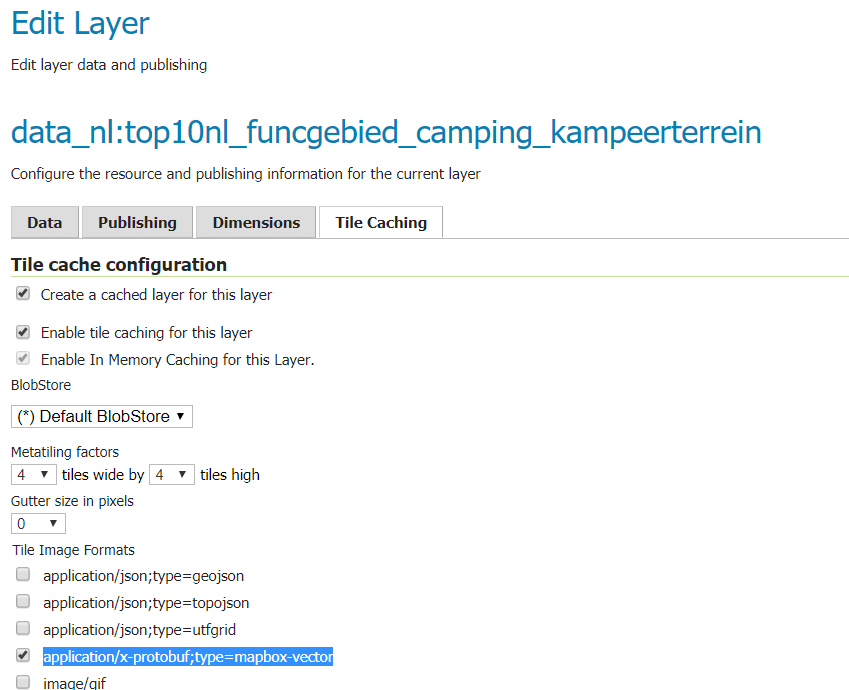
8. Click on your layer and go to ‘Tile Caching’. Now we have several extra Tile Image Formats available. Let’s activate the ‘application/x-protobuf;type=mapbox-vector’.
9. Scroll down and click on ‘save’.
10. We can now update our code and request vector tiles.
<!DOCTYPE html -->
<html>
<head>
  <title>My first leaflet webviewer</title>
  <!--Load leaflet -->
  <script src="https://unpkg.com/leaflet@1.3.1/dist/leaflet.js" integrity="sha512-/Nsx9X4HebavoBvEBuyp3I7od5tA0UzAxs+j83KgC8PU0kgB4XiK4Lfe4y4cgBtaRJQEIFCW+oC506aPT2L1zw==" crossorigin=""></script>
  <!--Load vectorGrid plugin for Leaflet -->
  <script src="https://unpkg.com/leaflet.vectorgrid@latest/dist/Leaflet.VectorGrid.bundled.js"></script>
  <!--Load the style stylesheet of leaflet -->
  <link rel="stylesheet" href="https://unpkg.com/leaflet@1.3.1/dist/leaflet.css" integrity="sha512-Rksm5RenBEKSKFjgI3a41vrjkw4EVPlJ3+OiI65vTjIdo9brlAacEuKOiQ5OFh7cOI1bkDwLqdLw3Zg0cRJAAQ==" crossorigin=""/>

  <style>
  /*Set the dimensions of our map  */
    .map {
      height: 100%;
      width: 100%;
    }
  </style>

</head>
<body>
<!--Create our map object  -->
<div id="map" class="map"></div>
</body>
</html>

<script>
// Find our map id
var map = L.map('map')
// Set open openstreetmap
L.tileLayer('https://{s}.tile.openstreetmap.org/{z}/{x}/{y}.png').addTo(map);

// Set vectorTileOptions
var vectorTileOptions = {
vectorTileLayerStyles: {
'top10nl_funcgebied_camping_kampeerterrein': function() {
return {
  color: 'red',
  opacity: 1,
  fillColor: 'yellow',
  fill: true,
}
},
},
interactive: true,	// Make sure that this VectorGrid fires mouse/pointer events
}

// Set the coordinate system
var projection_epsg_no = '900913';
// Set the variable for storing the workspace:layername
var campground_geoserverlayer = 'data_nl:top10nl_funcgebied_camping_kampeerterrein';
// Creating the full vectorTile url
var campingURL = '/geoserver/gwc/service/tms/1.0.0/' + campground_geoserverlayer + '@EPSG%3A' + projection_epsg_no + '@pbf/{z}/{x}/{-y}.pbf';
// Creating the Leaflet vectorGrid object
var camping_vectorgrid = L.vectorGrid.protobuf(campingURL, vectorTileOptions)

// Define the action taken once a polygon is clicked. In this case we will create a popup with the camping name
camping_vectorgrid.on('click', function(e) {
    L.popup()
      .setContent(e.layer.properties.naamnl)
      .setLatLng(e.latlng)
      .openOn(map);
  })
  .addTo(map);

// Add the vectorGrid to the map
camping_vectorgrid.addTo(map);

// Set the map view. In this case we set it to the Netherlands
map.setView([52.2,5.5], 8);

</script>
11. Reloading our webapp (http://localhost:8080/geoserver/www/first_leaflet_webviewer.html) should now show our layer.
Congratulations! You have finished the tutorial. You now have a functioning webapp which requests vector-tiles from a GeoServer while the data itself is stored in PostGIS database. Well done!
Thank you for completing this tutorial. If you learnt something and feel generous, please buy me coffee by making a small donation. Thank You!