Creating a Timeseries with GeoServer and Open Layers
In this tutorial I will show how to set up a timeseries in GeoServer and connect it to an OpenLayers webviewer.
GeoServer
An open-source server program made for serving spatial data (vector and raster). GeoServer is capable of instant tiling, styling and projection transformation. GeoServer also allows the client to request the data in many data formats and supports both WMS and WFS.
OpenLayers
A small open-source JavaScript library for interactive maps. A good alternative can be Leaflet.
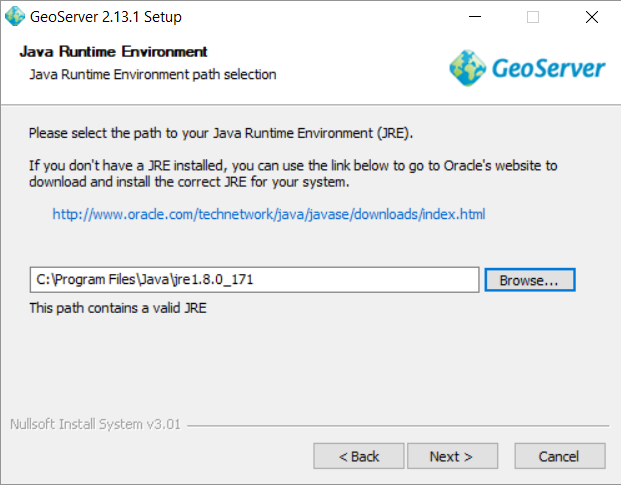
1. A prerequisite for GeoServer is the Java Runtime Environment (JRE). At the time of writing GeoServer requires JRE 8. You can download it here: http://www.oracle.com/technetwork/java/javase/downloads/jre8-downloads-2133155.html
2. Install the .exe of JRE and follow all the steps.
3. Download GeoServer from http://geoserver.org/download/
4. Launch the .exe of the GeoServer. You can accept the standard settings. You also need to specify where you installed the JRE 8 (normally you can find the folder in your ‘Program Files’).
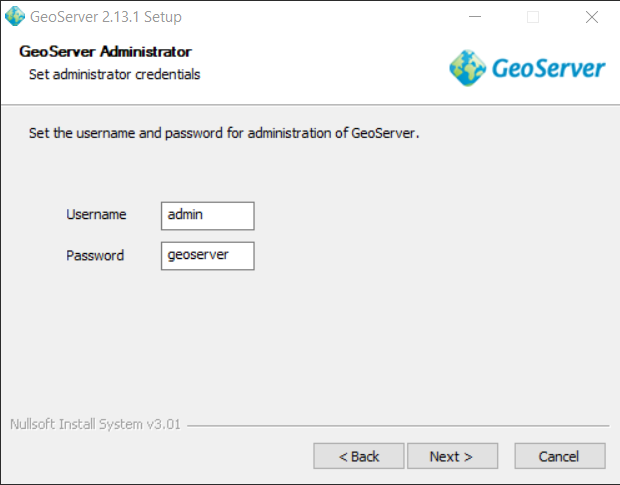
5. Take note of the administration credentials. You can accept the standard (Username: ‘admin’, Password: ‘geoserver’ for now and change them later.
6. Take note of the web server port. You can leave it on port 8080.

7. Finish the installation.
Congratulations! You now have your own GeoServer installed. Let’s start it up.
8. Start the GeoServer (Start => All Programs => GeoServer … => Start GeoServer).

9. Wait for the comman shell to start everything up. Then go to http://localhost:8080/geoserver/ (if you have entered a different port you need to use this instead of 8080).
10. Login with your admin credentials (username: ‘admin’, password: ‘geoserver’).
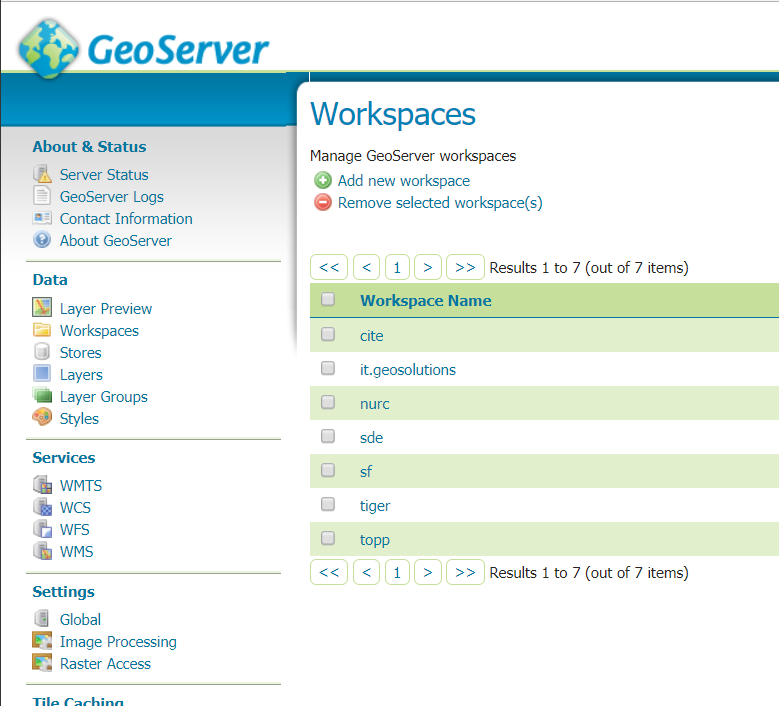
11. Go to ‘Workspaces’ and click on ‘Add new workspace’.
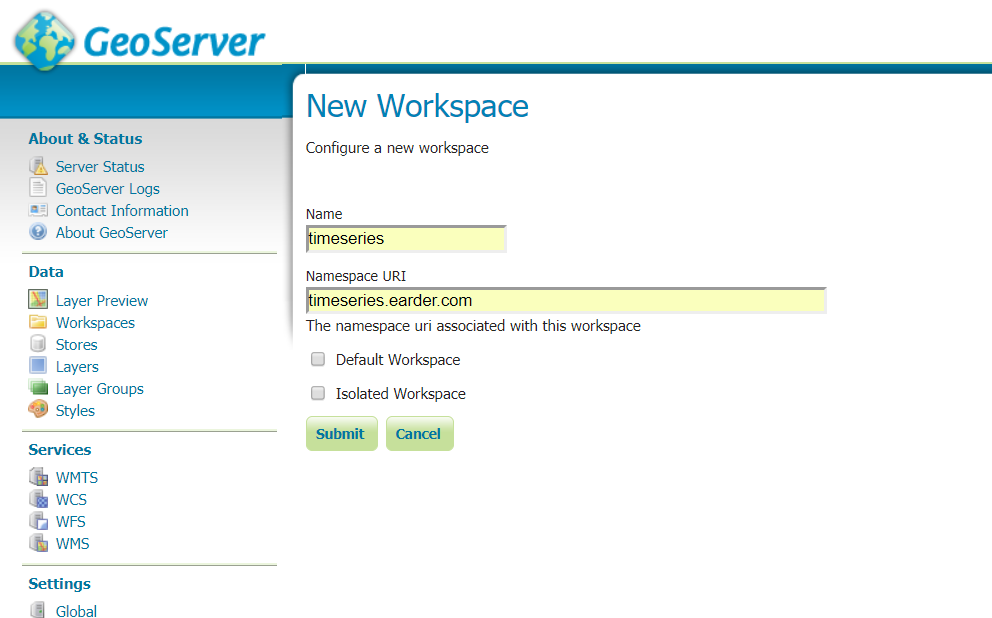
12. Add a name (I will use ‘timeseries’) and a Namespace URI (I will use timeseries.earder.com) and click submit.
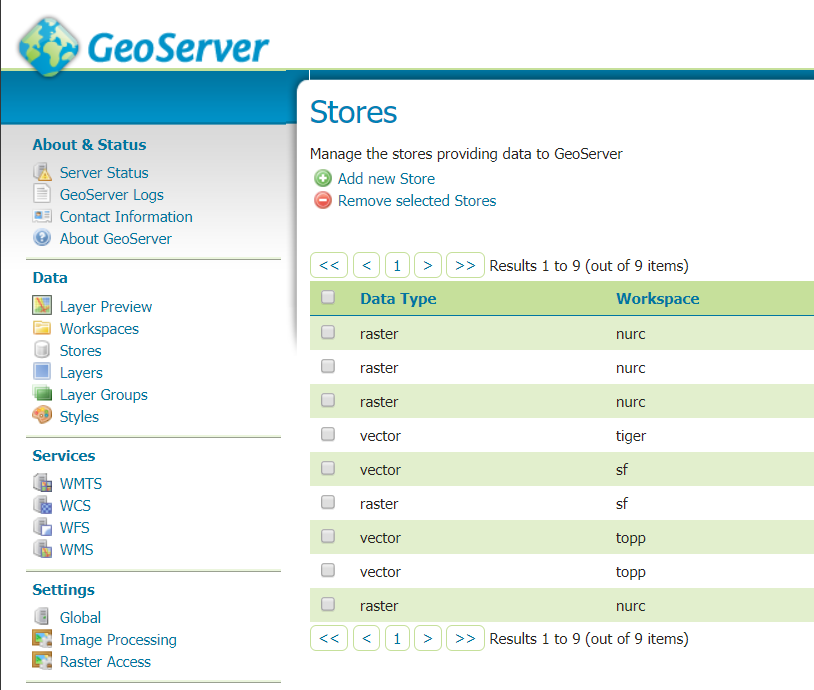
13. Go to ‘Stores’ and click on ‘Add new Store’.
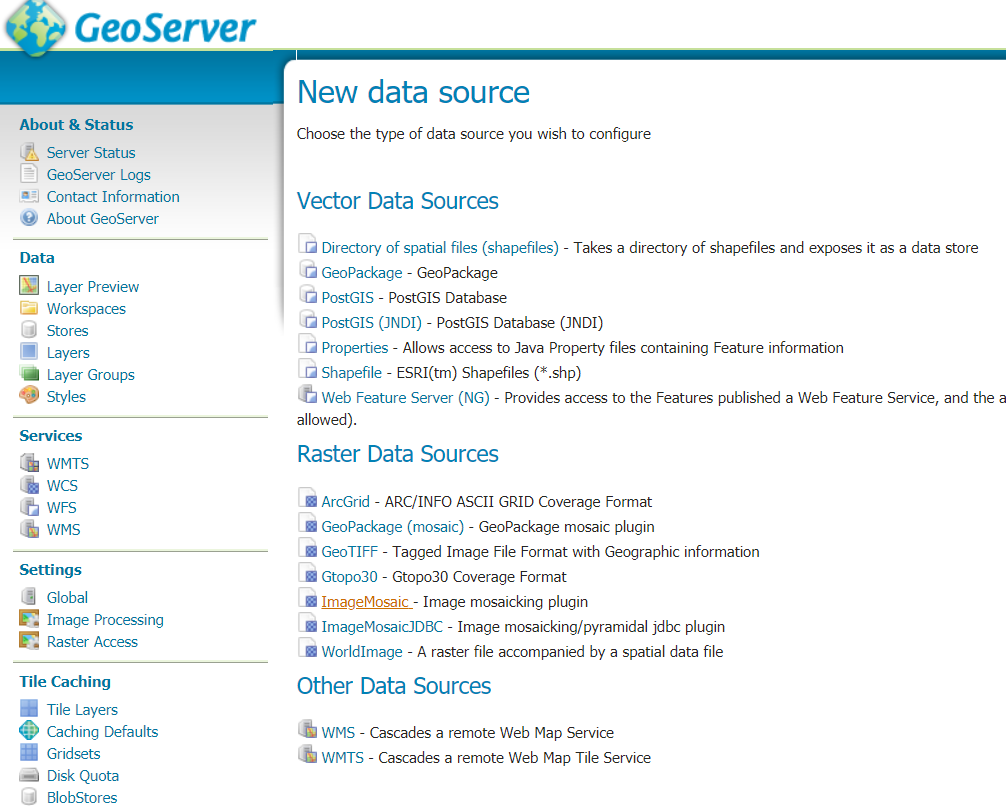
14. Click on ImageMosaic.
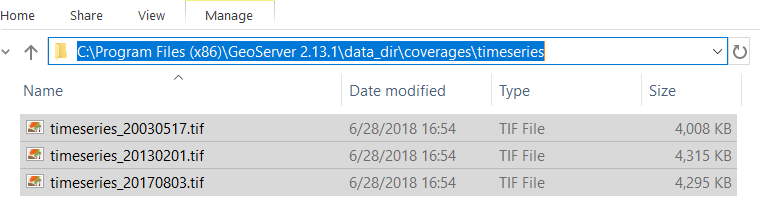
15. Go to the coverages folder in your data directory of your GeoServer (Start => All Programs => GeoServer … => data_dir => coverages) and create a new folder for your data. I will call this folder ‘timeseries’. Now add your data to this folder. You can use the following files: timeseries_20030517.tif, timeseries_20130201.tif, timeseries_20170803.tif
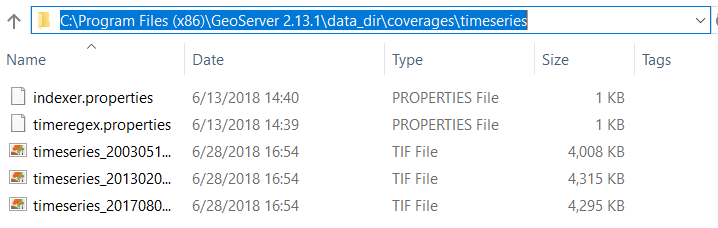
16. We also need to add some properties files to specify how to extract the date from the file title. We can use the following files and place them in the same folder: indexer.properties and timeregex.properties
17. We can now go back to our browser and select the workspace and data directory.
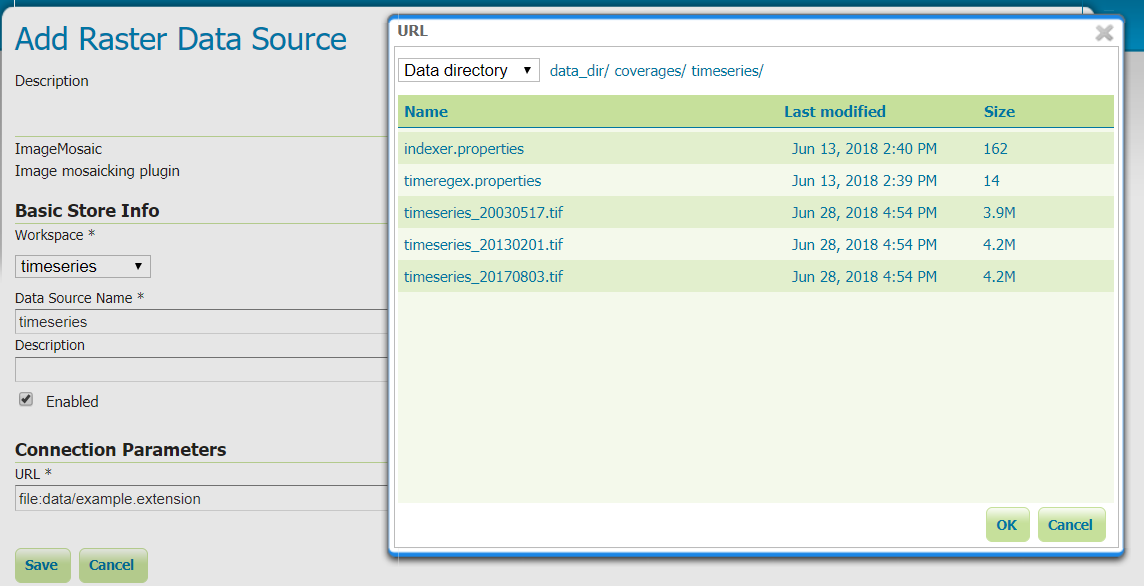
18. Click ‘save’ and then on ‘Publish’.

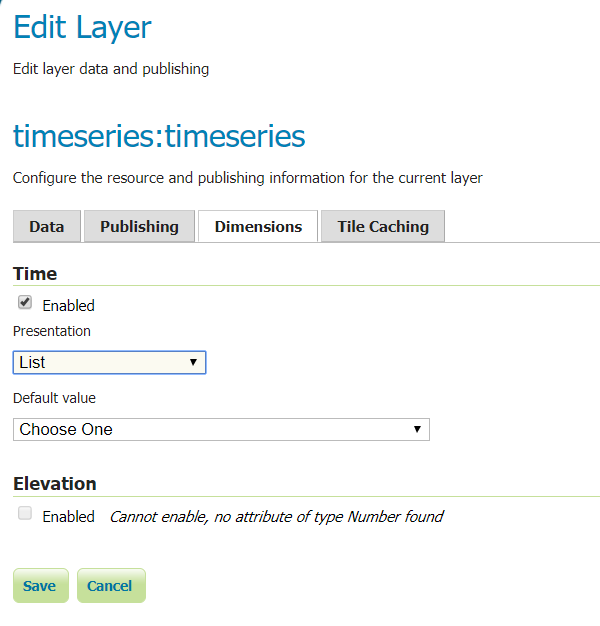
19. Go to ‘Dimensions’ and check ‘Time: Enabled’, and make the ‘Presentation’ a list. Then click ‘Save’.
20. We now have a online layer with a timestamp enabled. We can now create our OpenLayers viewer. You can use any html/JavaScript editor you like. If you don’t have one installed yet, I like Atom: https://atom.io.
21. Save the file in the ‘www’ directory of GeoServer (Start => All Programs => GeoServer … => data_dir => www).
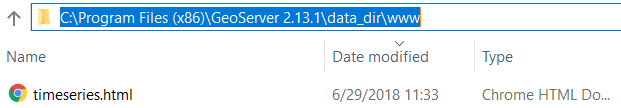
22. We can now visit the our webviewer: http://localhost:8080/geoserver/www/timeseries.html
Congratulations! You have now created a online timeseries. The result should look like this: